Research Operations
Research Ops — process, documentation, tooling, and socialisation
product-designux-researchdesign-leadership
Research at CloudBees was project-by-project — no shared process, no tooling, no taxonomy. Insights were siloed, duplicate work was common, and there was no institutional memory across a growing design team.
Built the first Research Operations practice: process documentation, Dovetail as the shared repository with a coordinated tagging taxonomy, and a Double Diamond-aligned process mapped into Jira and Confluence. The programme earned executive buy-in — a dedicated researcher was hired, a Data Insights team merged into design, and a second researcher hire was underway.
01 Process
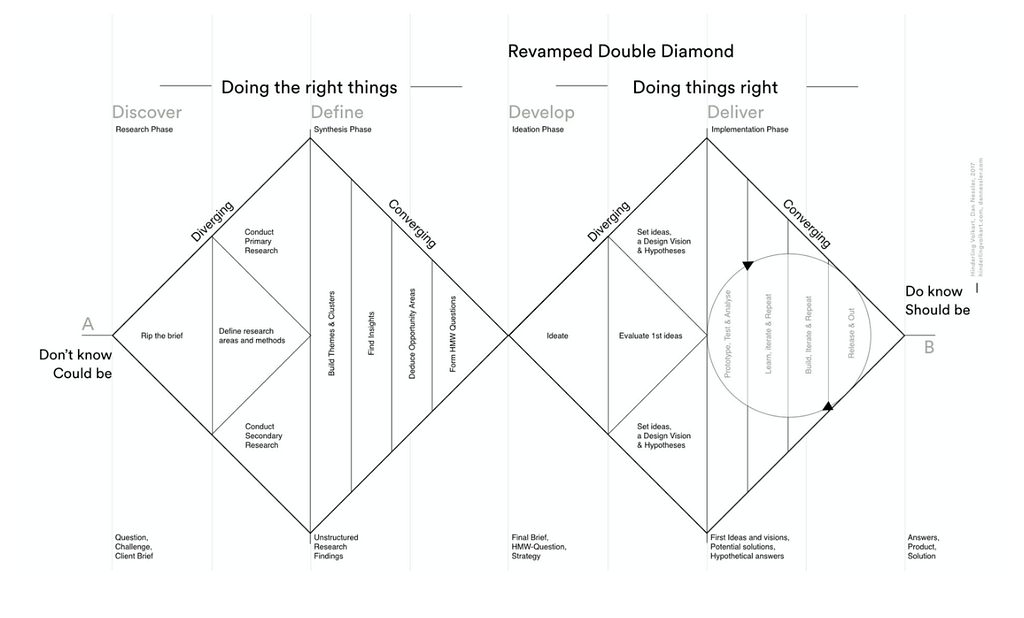
The starting point was alignment — mapping the research lifecycle to the Design Council's Double Diamond, then replicating the model in both Jira and Confluence: linked, parallel, and accessible to any designer or PM in the organisation. Research sits in the first diamond: 'Research' is about building the right thing; 'Operations' is about doing it right.
02 Documentation
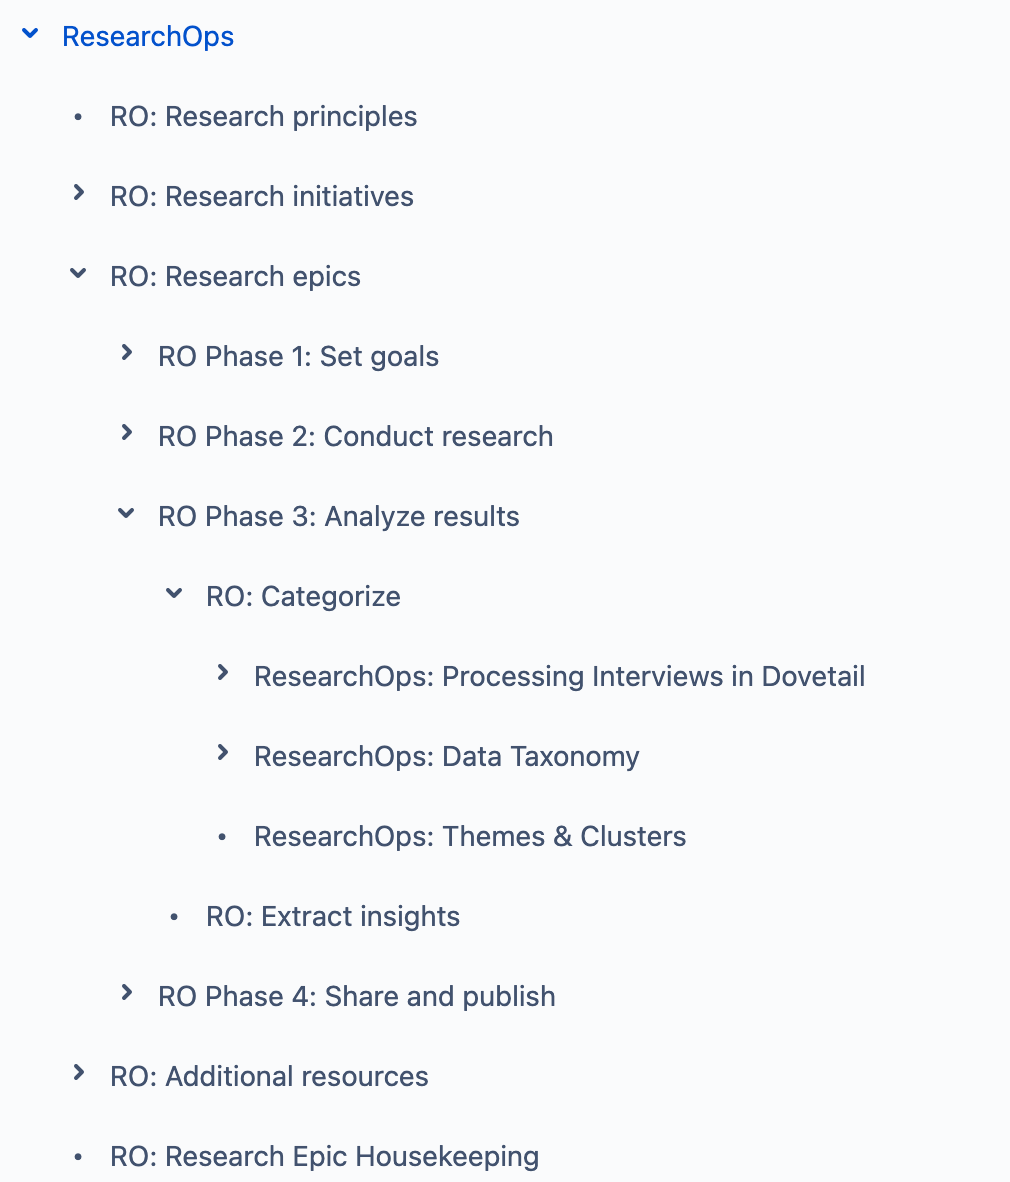
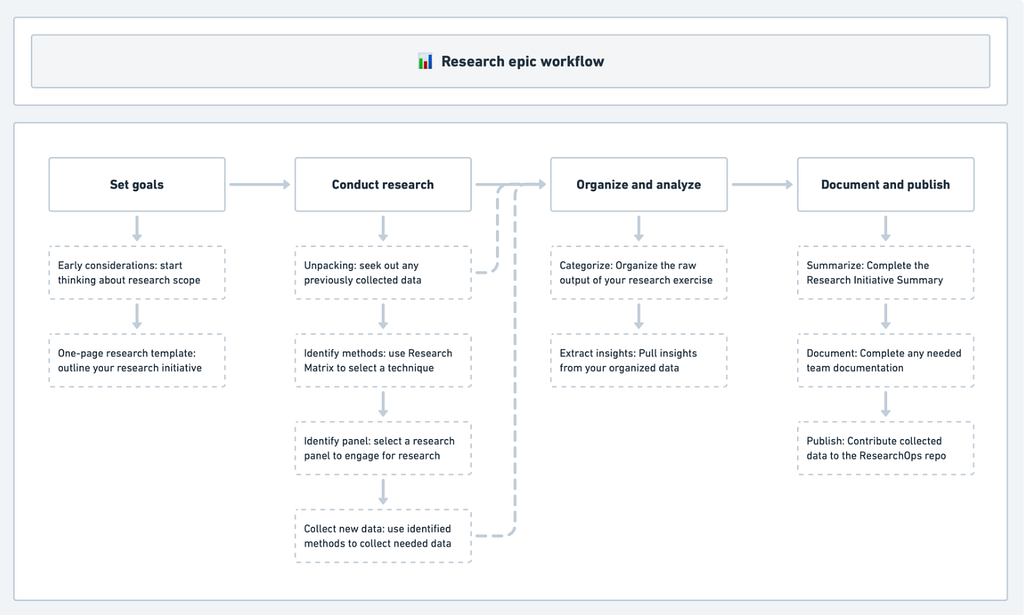
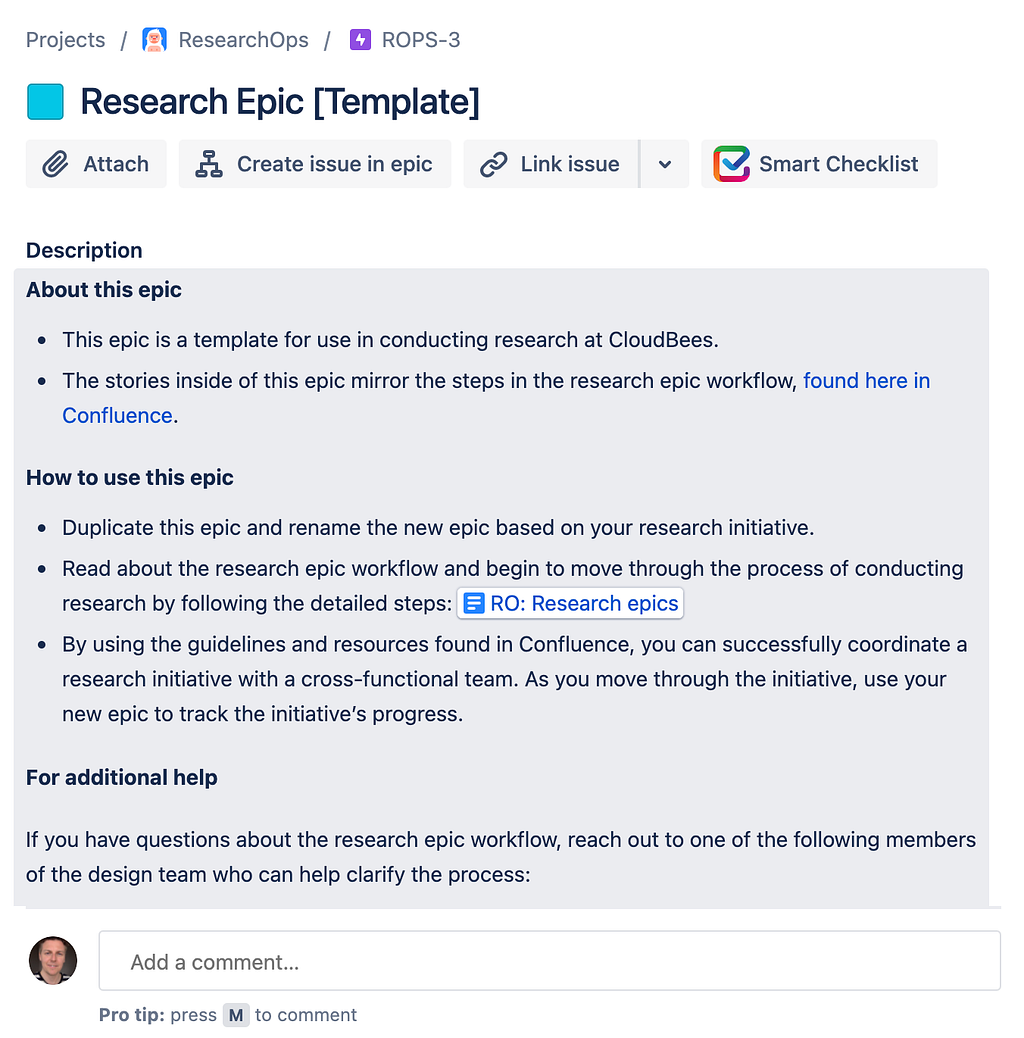
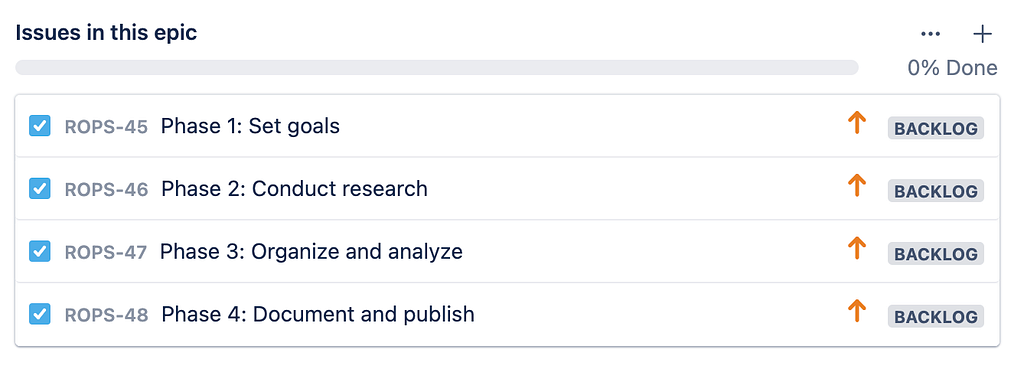
I broke the first diamond into detailed Confluence sections — best practices, method templates, and guidelines for each research phase. A parallel Jira Research Epic template gave teams four subtasks, one per phase, each linking to the documentation behind it. A colleague extended the structure into a detailed diagram that became the canonical internal reference.
03 Tooling
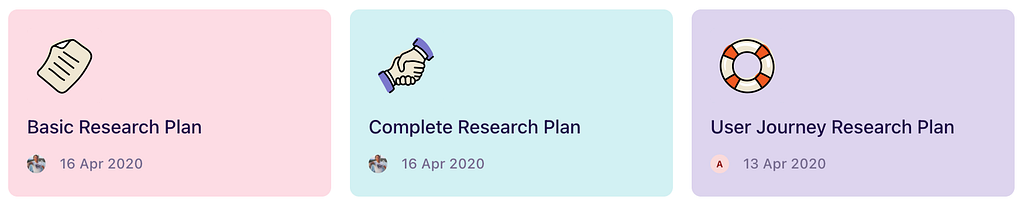
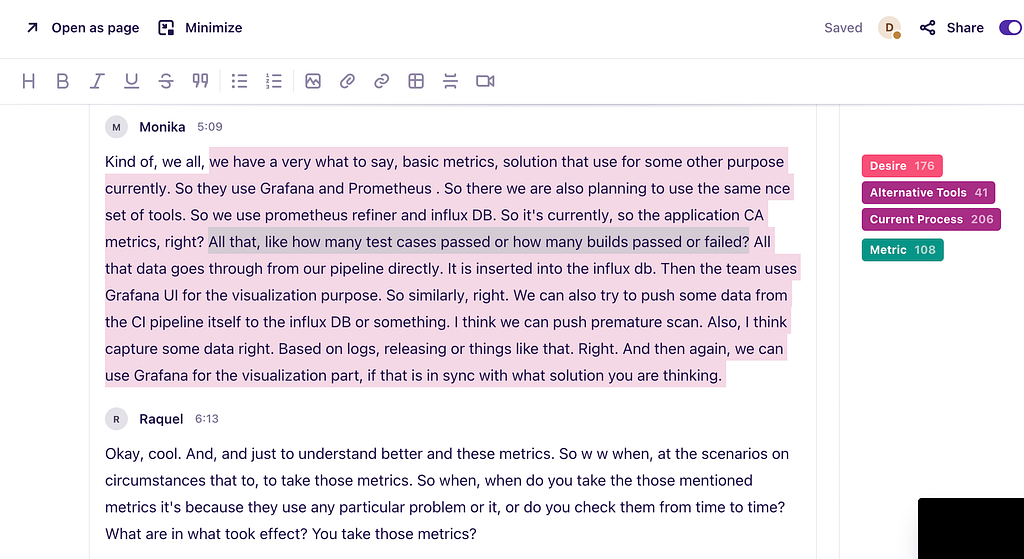
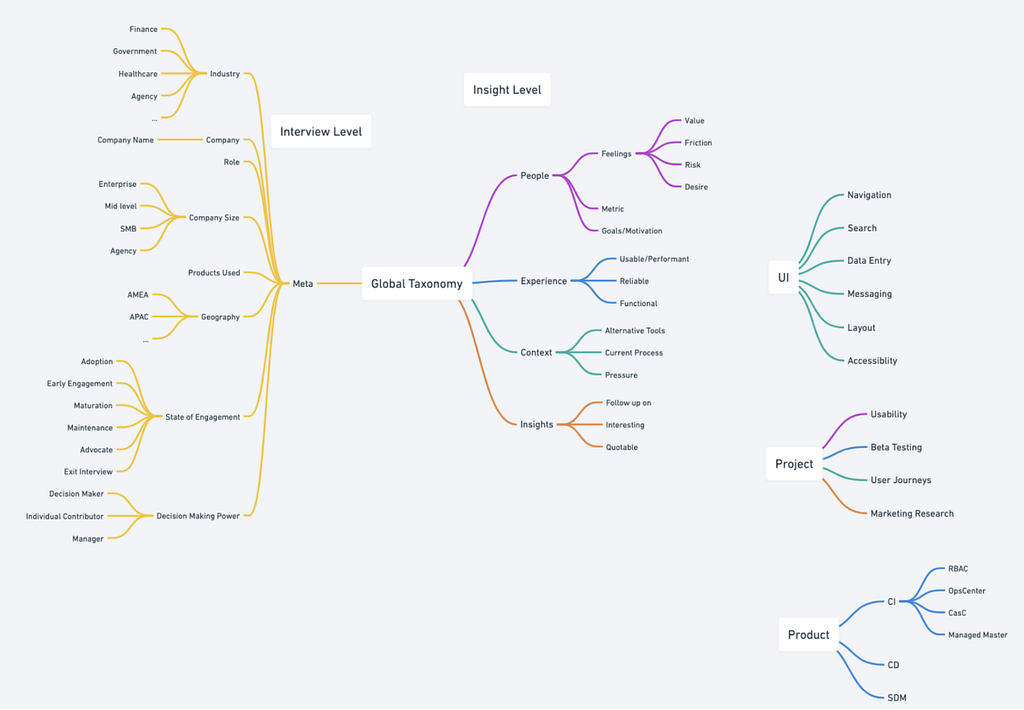
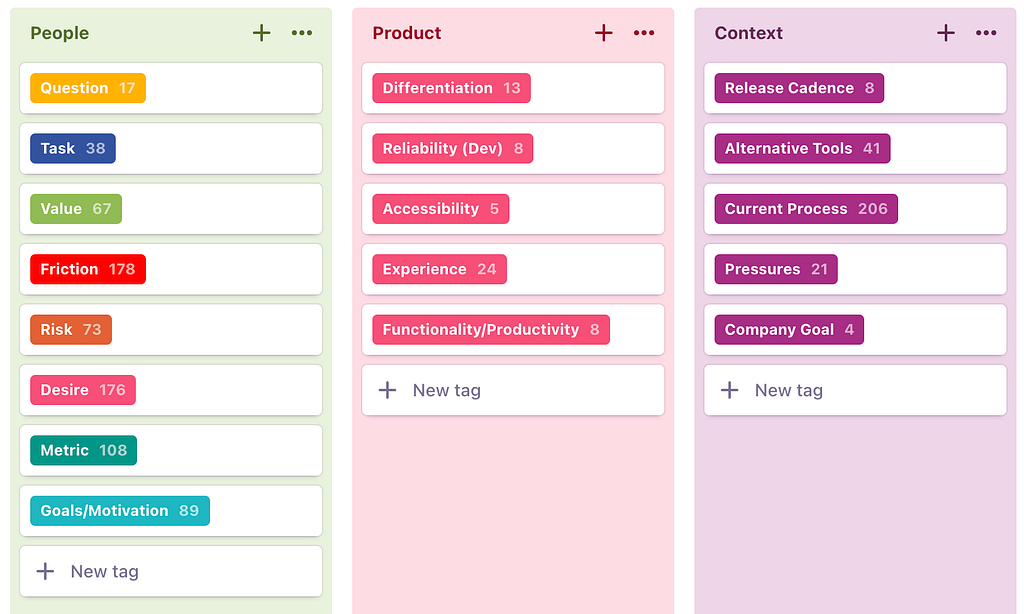
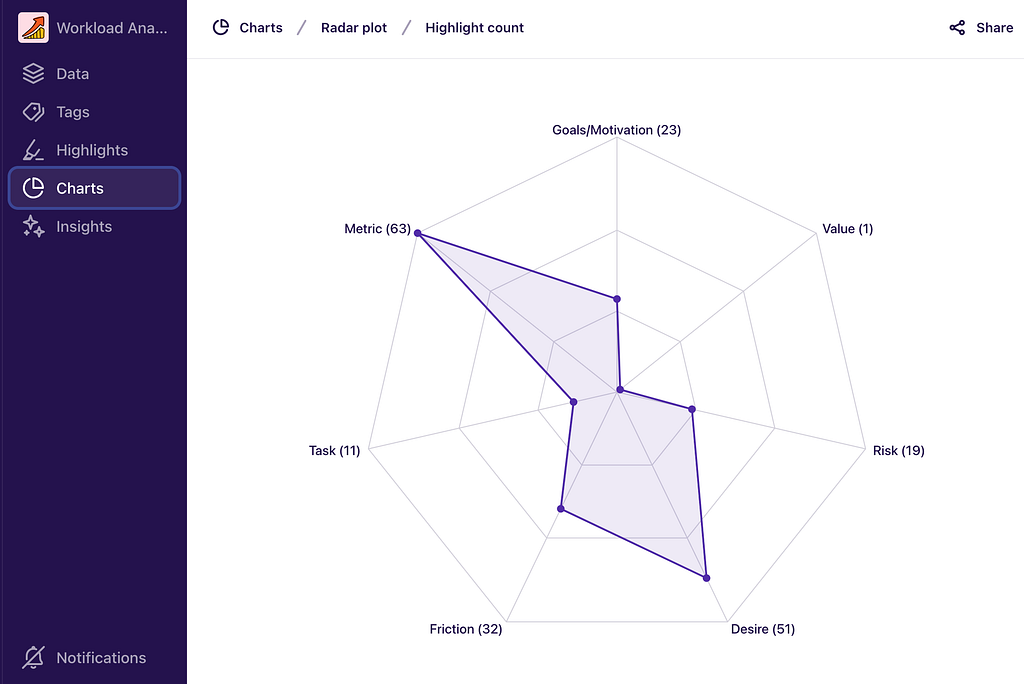
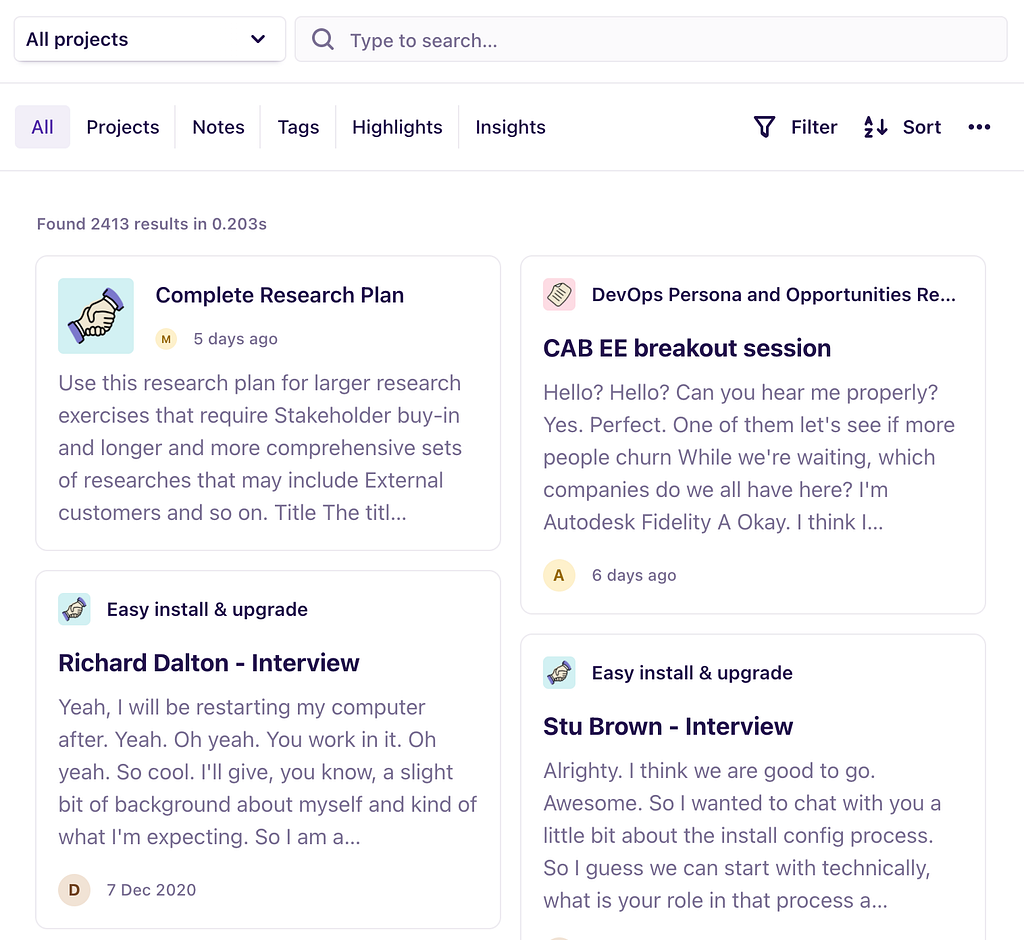
After evaluating Confluence as a research repository and finding it insufficient, I identified Dovetail and made the case for it. Before rolling it out to the team, I designed a data taxonomy — a controlled tagging vocabulary so that research from multiple contributors could be sorted, filtered, and compared coherently. Without a shared taxonomy, tags spiral into noise. Three capabilities made the investment worthwhile: charting tag distributions, searching across all projects at once, and drilling from any insight back to the source interview transcript.
04 Outcome
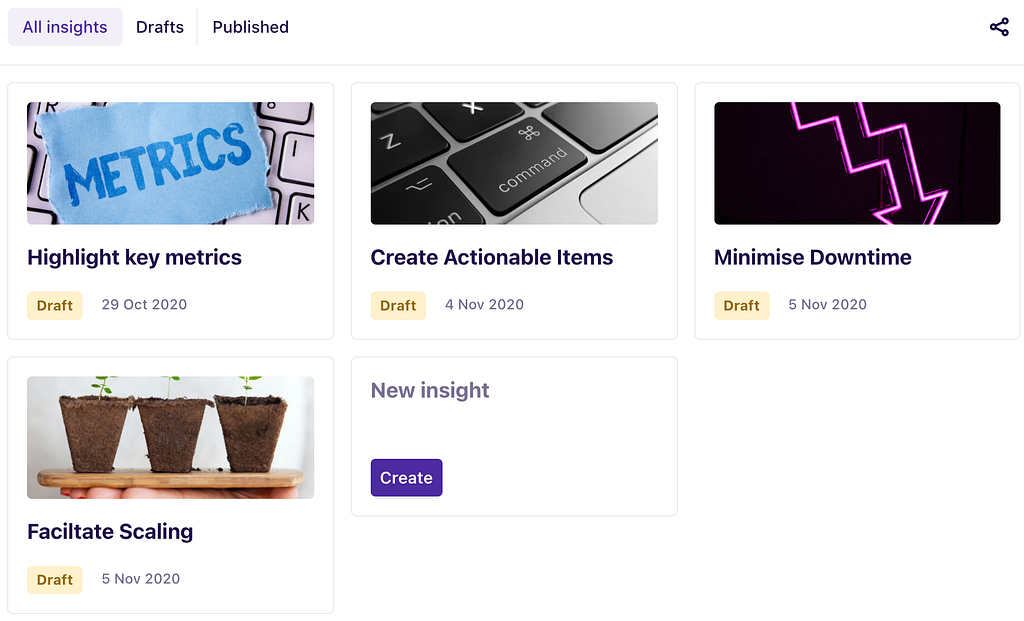
The rollout went to the design team first, then to product. The Dovetail demo — tagging and insights in particular — was an immediate sell to PMs. It eventually expanded from the design team to the wider product organisation. Executive buy-in followed: a dedicated researcher was hired, and the Data Insights team was imported into the Design group and merged with research. A second researcher hire was in progress as the programme continued to grow.